Longer data retention in InfluxDB 1.8, Grafana
The ID Service stores metrics data to an InfluxDB service with a default retention policy of 24 hours. This may not be long enough time for your use cases. This document will show with examples how to store metrics data for a longer period of time, and how to configure Grafana to display it.
The theory
To store measurements for a longer time, it must be stored with a Retention Policy of desired length. It doesn’t make sense to store ALL data for the specified time: When Grafana shows values from a month in a graph, it physically cannot display data at 50 millisecond accuracy. Having a lot of data at very short intervals takes a lot of processing, bandwidth and disk space. So you must think about downsampling the data as well.
Downsampling and retaining data is done with two tools:
-
Continuous Query (CQ) - an automatically, periodically run query which collects and downsamples data
-
Retention Policy (RP) - Definition of how long the data is kept
InfluxDB 1.8 documentation
Using already existing data
The ID service may have already added Continuous Queries and Retention
Policies that meet your needs. Check the existing queries with the
influx prompt:
> use oneportal
Using database oneportal

> show continuous queries
name: _internal
name query
---- -----

name: oneportal
name                                         query
----                                         -----
openid_api_requests_hourly                   CREATE CONTINUOUS QUERY openid_api_requests_hourly ON oneportal BEGIN SELECT count(auth_header_exists) INTO oneportal.one_year.openid_api_requests_hourly FROM oneportal.one_day.openid_api_request GROUP BY time(1h), path, method END
openid_api_requests_daily                    CREATE CONTINUOUS QUERY openid_api_requests_daily ON oneportal BEGIN SELECT sum(count) INTO oneportal.five_years.openid_api_requests_daily FROM oneportal.one_year.openid_api_requests_hourly GROUP BY time(1d), path, method END
mgmt_api_requests_hourly                     CREATE CONTINUOUS QUERY mgmt_api_requests_hourly ON oneportal BEGIN SELECT count(auth_header_exists) INTO oneportal.one_year.mgmt_api_requests_hourly FROM oneportal.one_day.mgmt_api_request GROUP BY time(1h), path, method, api_client_id, oauth2_client_id END
mgmt_api_requests_daily                      CREATE CONTINUOUS QUERY mgmt_api_requests_daily ON oneportal BEGIN SELECT sum(count) INTO oneportal.five_years.mgmt_api_requests_daily FROM oneportal.one_year.mgmt_api_requests_hourly GROUP BY time(1d), path, method, api_client_id, oauth2_client_id END
log_entry_hourly                             CREATE CONTINUOUS QUERY log_entry_hourly ON oneportal BEGIN SELECT count(event_id) INTO oneportal.one_year.log_entry_hourly FROM oneportal.one_day.log_entry GROUP BY time(1h), target_namespace_id, target_type, source, log_level, log_life END
log_entry_daily                              CREATE CONTINUOUS QUERY log_entry_daily ON oneportal BEGIN SELECT sum(count) INTO oneportal.five_years.log_entry_daily FROM oneportal.one_year.log_entry_hourly GROUP BY time(1d), target_namespace_id, target_type, source, log_level, log_life END
filterable_service_find_max_results_hourly   CREATE CONTINUOUS QUERY filterable_service_find_max_results_hourly ON oneportal BEGIN SELECT max(results) INTO oneportal.one_year.filterable_service_find_max_results_hourly FROM oneportal.one_day.filterable_service_find GROUP BY time(1h), service_class END
filterable_service_find_count_queries_hourly CREATE CONTINUOUS QUERY filterable_service_find_count_queries_hourly ON oneportal BEGIN SELECT count(results) INTO oneportal.one_year.filterable_service_find_count_queries_hourly FROM oneportal.one_day.filterable_service_find GROUP BY time(1h), service_class END
Above we see from the first result that there exists a query called
openid_api_requests_hourly which collects a field called count which
is a sum of auth_header_exists values (e.g. a count of requests),
grouped with 1 hour accuracy for each path and method combination. It is
available in the one_year retention policy with name
openid_api_requests_hourly.
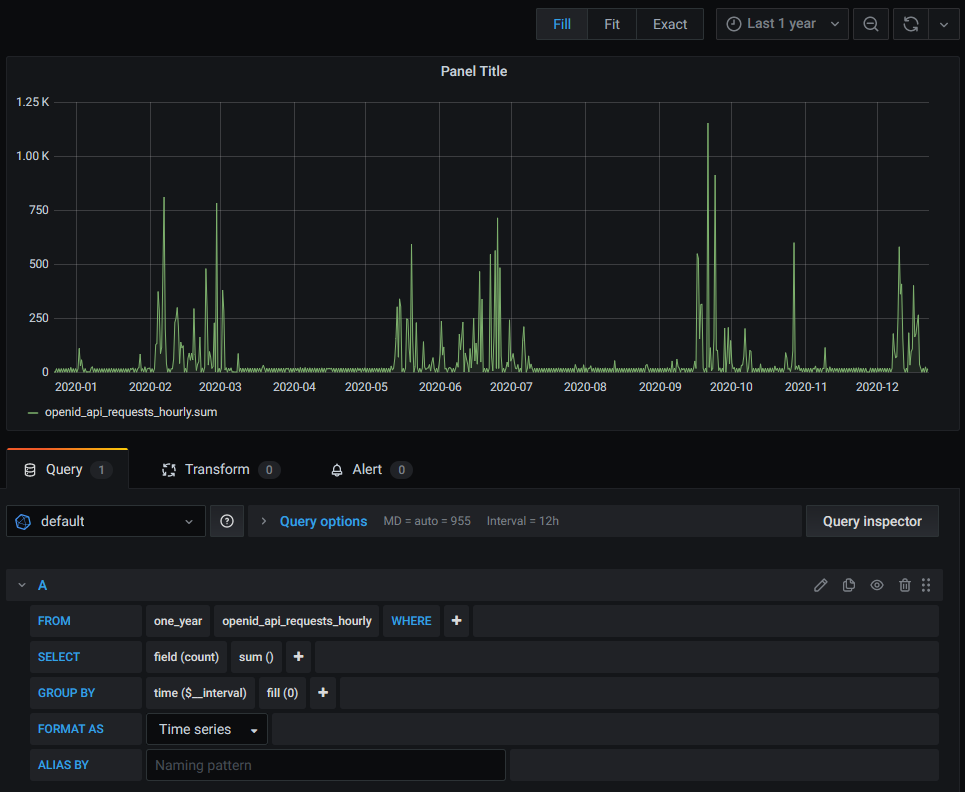
This existing continuous query data can be used in Grafana with the following configuration:

Creating a new RP and CQ
Let’s suppose there isn’t a CQ and RP that meet our requirements.
Requirements
We need to have a Grafana display which shows Management API request counts by path, and we need to show data for the last 30 days. We need to be able to display data for quite a short interval, so let’s pick an interval of 5 minutes.
In summary:
-
We need to store metrics data about Management API requests
-
For 30 days
-
With 5 minute interval accuracy
-
This means we will have 30 * 24 * (60/5) = 8640 measurements per any stored tag combination. This is a reasonable amount of data to process.
What we already have
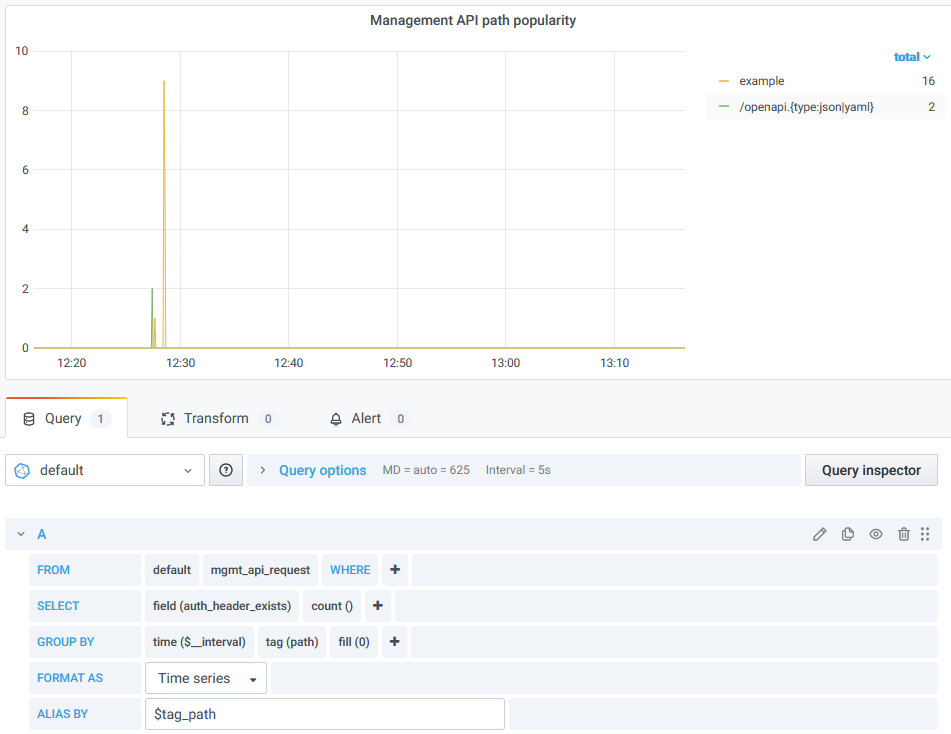
We can show a graph for the last 24 hours with the following Grafana Panel configuration:

The essential info we see from this configuration is:
-
Data is stored with the default retention policy (which we know is
one_dayby using theshow retention policiescommand) with measurement namemgmt_api_request. -
There’s a field or tag called
auth_header_exists, and in this graph we display the number of them by using thecount()function. -
We group by time and also the tag
path. -
The
pathtag is also used as an alias, the value of which is shown in the legend.
Create a Retention Policy
We need a retention policy that is at least 30 days long. Let’s see what is available:
> show retention policies
name       duration   shardGroupDuration replicaN default
----       --------   ------------------ -------- -------
autogen    0s         168h0m0s           1        false
five_years 43680h0m0s 168h0m0s           1        false
one_day    24h0m0s    1h0m0s             1        true
one_year   8736h0m0s  168h0m0s           1        false
We see that one_day is indeed the default, and the next longest is
one_year. Since that is too long, we should create a new RP called
one_month that has a duration of 30 days, or 720 hours.
> CREATE RETENTION POLICY "one_month" ON "oneportal" DURATION 720h REPLICATION 1
Now we can confirm that it was added.
> show retention policies
name       duration   shardGroupDuration replicaN default
----       --------   ------------------ -------- -------
autogen    0s         168h0m0s           1        false
five_years 43680h0m0s 168h0m0s           1        false
one_day    24h0m0s    1h0m0s             1        true
one_year   8736h0m0s  168h0m0s           1        false
one_month  720h0m0s   24h0m0s            1        false
Create a Continuous Query
Let’s create a CQ that collects everything usable from default
mgmt_api_request data. We can find the tag and field names with
commands like SELECT * FROM mgmt_api_request LIMIT 1.
CREATE CONTINUOUS QUERY "mgmt_api_requests_5min_for_1month" ON "oneportal" BEGIN SELECT count(auth_header_exists) AS "count_requests", sum("request_duration") AS "sum_request_duration", mean("request_duration") AS "mean_request_duration" INTO "one_month"."mgmt_api_requests" FROM "mgmt_api_request" GROUP BY time(5m), "path", "method", "api_client_id", "oauth2_client_id" END
We could have created a CQ that collects only the number of requests and groups them by path, but in anticipation of other needs, we collect more data and more tags.
Note:
-
The data will be stored with RP
one_monthand namemgmt_api_requests -
It will have the following values:
-
count_requests: The number of requests made during 5 minutes. This is needed in our example. -
sum_request_duration: A sum of the duration of request processing during 5 minutes. This can be used to display which requests are slowest to process and might be the causes of performance problems. -
mean_request_duration: The mean duration of request processing during 5 minutes. This can be used to display how long requests take on average. -
Tags
path,method,api_client_idandoauth2_client_id. Of thesepathis needed for our example, others can be used in other graphs.
-
-
The fields
response_code,request_uriapparently cannot be used for grouping in a CQ, so they are not included.
Test the Continuous Query
Make a few Management API calls to add data.
curl -X GET "https://your-id-server.com/api/rest/v1/version"
Wait 5 minutes for the CQ to run. Then run the query:
> SELECT * FROM one_month.mgmt_api_requests
name: mgmt_api_requests
time                api_client_id    count_requests mean_request_duration method path                       sum_request_duration
----                -------------    -------------- --------------------- ------ ----                       --------------------
1608640500000000000 1248769513590337 1              14                    GET    user/{userId}/customfields 14
1608640500000000000 1248769513590337 2              48.5                  POST   user/{userId}/customfields 97
1608640500000000000                  5              2                     GET    example                    10
1608641100000000000                  6              1.8333333333333333    GET    version                    11
We see that 6 such requests were made, with an average processing time of 1.83 ms.
Update the Grafana panel
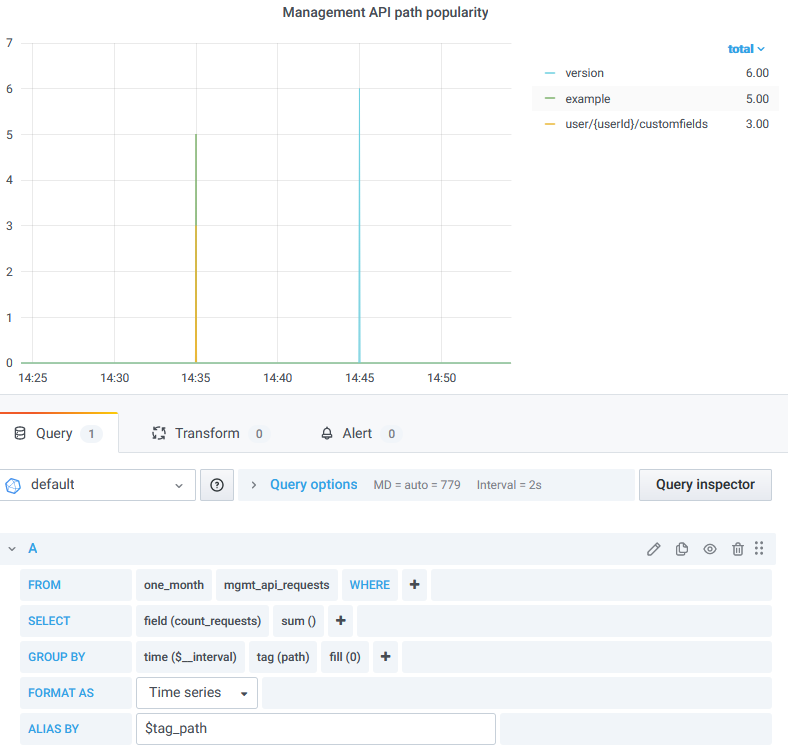
Make a duplicate of the original panel as a backup. Update the panel query configuration:
-
In FROM use the
one_monthRP and themgmt_api_requestsname, -
change the SELECT parameters to use field
count_requestsand the function tosum()since we now need to add the counts up.

The equivalent query is:
SELECT sum("count_requests") FROM "one_month"."mgmt_api_requests" WHERE $timeFilter GROUP BY time($__interval), "path" fill(0)
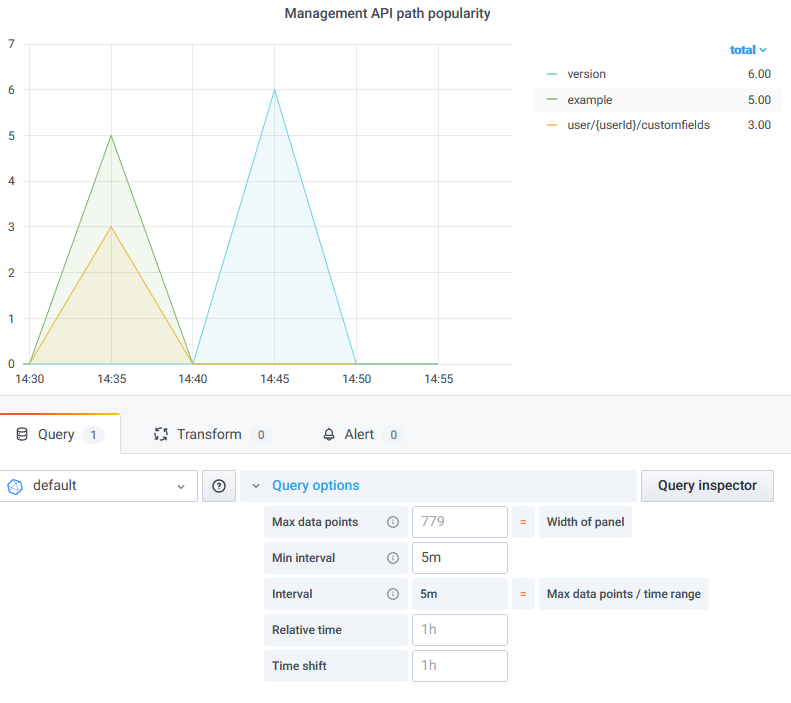
The graph now shows the expected correct values. You should change the
Min interval to 5m to match the CQ, and to visualise that the data
covers a 5 minute period.

More CQ examples
Number of Management API requests that ended if error code (>= 400):
CREATE CONTINUOUS QUERY mgmt_api_request_errors_5min_for_1month ON oneportal BEGIN SELECT count(auth_header_exists) AS count_requests INTO oneportal.one_month.mgmt_api_request_errors FROM oneportal.one_day.mgmt_api_request WHERE response_code >= 400 GROUP BY time(5m), api_client_id, oauth2_client_id, path END
Number of Management API requests that ended in successful code (200 to 399):
CREATE CONTINUOUS QUERY mgmt_api_request_successes_5min_for_1month ON oneportal BEGIN SELECT count(auth_header_exists) AS count_requests INTO oneportal.one_month.mgmt_api_request_successes FROM oneportal.one_day.mgmt_api_request WHERE response_code >= 200 AND response_code < 400 GROUP BY time(5m), api_client_id, oauth2_client_id, path END
Number of OpenID API requests, similar to number of Management API requests in the above example:
CREATE CONTINUOUS QUERY "openid_api_requests_5min_for_1month" ON "oneportal" BEGIN SELECT count(auth_header_exists) AS "count_requests" INTO "one_month"."openid_api_requests" FROM "openid_api_request" GROUP BY time(5m), "path", "method" END
Number of log entries:
CREATE CONTINUOUS QUERY "log_entries_5min_for_1month" ON "oneportal" BEGIN SELECT count("event_id") AS "count_entries" INTO "one_month"."log_entries" FROM "log_entry" GROUP BY time(5m), "source" END