Metrics visualisation with Grafana
Trivore ID can collect diagnostic information about its internal operation into an InfluxDB database. This data can be visualised using external tools, such as Grafana. This document has guidance on how to install and configure Grafana, and how to set up some basic panels.
Grafana setup
Install Grafana to your server using the official instructions for your operating system. Prepare the configuration file (grafana.ini or custom.ini, depending on your system, as mentioned in the instructions). The initial login is admin/admin.
Optional OAuth login with Trivore ID
Grafana supports using an external OAuth system for logging in.
Register a new OpenID Client in Trivore ID with settings:
| Setting | Value |
|---|---|
| Confidential | Selected |
| Redirect URLs | https://YOUR.GRAFANA.SERVER/login/generic\_oauth |
Set it up in the Grafana configuration file in the [auth.generic_oauth] section:
#################################### Generic OAuth ##########################
[auth.generic_oauth]
enabled = true
name = onePortal
;allow_sign_up = true
client_id = YOUR_CLIENT_ID
client_secret = YOUR_CLIENT_SECRET
scopes = openid profile email
auth_url = https://YOUR.TRIVOREID.SERVER/openid/auth
token_url = https://YOUR.TRIVOREID.SERVER/openid/token
api_url = https://YOUR.TRIVOREID.SERVER/openid/userinfo
You still need to create user accounts in Grafana and send invites. If
you enable allow_sign_up this may be skipped.
Add a data source
After logging in to Grafana you are suggested to add a Data Source. Add an InfluxDB data source. If you run Grafana on the same server as InfluxDB, you can use the following settings:
| Setting | Example value |
|---|---|
| Name | influxdb |
| Type | InfluxDB |
| Default | Selected |
| URL | http://localhost.8086 |
| Access | Server |
| Database | oneportal |
| User | root |
| Password | **** |
Examples
Panels
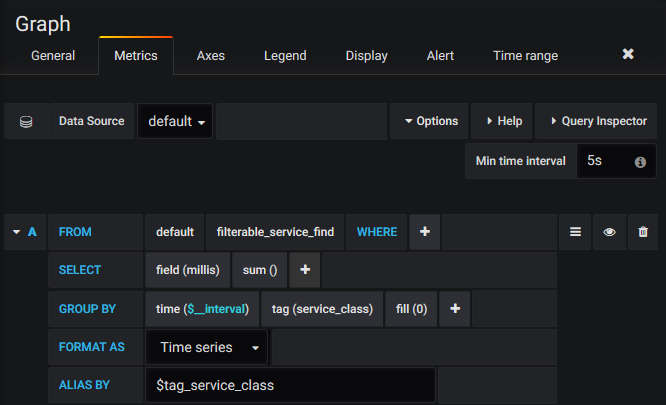
Time spent on filterable-service queries:

Dashboards
Download and import the JSON file as a new dashboard by clicking the + icon and selecting "Import", then "Upload .json File".